How to Make Accessible Complex Images (Section 8A)
How to Make Accessible Complex Images
Complex Images include graphs, charts, diagrams, maps, and illustrations. Below are 3 ways to provide alternative (alt) text-based description for complex images, when a simple alt text attribute is insufficient. Choose the best Alt text method for your image types.
A. Use a Caption/Title.
For Bb content: Your caption must be associated with the image. Make sure to include a properly added caption in the Title field. Select the image, select the Bb image editor, and type your caption into the Title field. Save your changes with Submit.
Note: Do not use the Bb image description field.
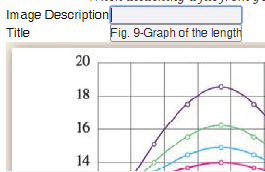
For MS Word and PowerPoint: Select the image, and select Insert Caption:
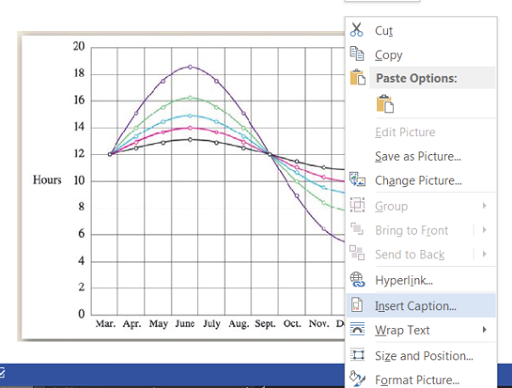
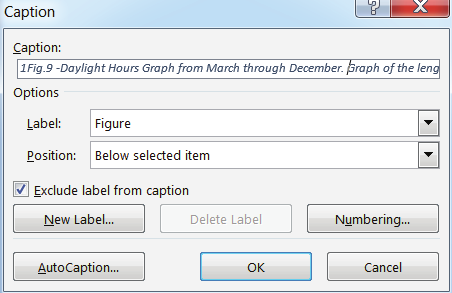
Type the graph title and caption into the Caption field: Fig.9 -Daylight Hours Graph from March through December. Graph of the length of daylight from March through December at various latitudes. For example, at 40 degree latitude there are 12 hours of daylight in March. In October, there are 10.8 hours of daylight at 40 degrees.
B. Describe in surrounding text.
If the image is adequately described in surrounding text (including text-based data tables), so that the image is just reinforcing the text, no further description is needed.
Example: Modeling amount of daylight as a function of time of year, Figure 9 and the table following show the number of hours of daylight as functions of the time of the year at several latitudes, from March through December.
Note: Since these images are adequately described in surrounding text, make sure to put "Null" in the Bb title or MS Office caption field.
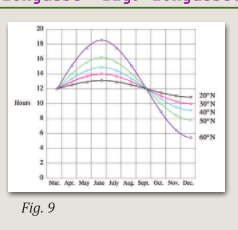
| Month/Degree | 20º | 30º | 40º | 50º | 60º |
|---|---|---|---|---|---|
| March | 12 | 12 | 12 | 12 | 12 |
| Apr. | 12.3 | 13.2 | 13.5 | 14 | 17.5 |
| May | 12.9 | 13.7 | 14.3 | 15.5 | 17.7 |
| June | 13 | 14 | 14.9 | 16.1 | 18.2 |
| July | 12.8 | 13.8 | 14.2 | 15.7 | 17.8 |
| Aug. | 12.5 | 12.8 | 13.2 | 14 | 15 |
| Sep. | 12 | 12 | 12 | 12 | 12 |
| Oct. | 11.6 | 11.2 | 10.8 | 10 | 9 |
| Nov. | 11 | 10.2 | 9.7 | 8.3 | 6.5 | Dec. | 10.9 | 10 | 9.1 | 7.9 | 5.7 |
Example of Data Table for Figure 9
C. Link out to a web page with a longer description.
If the image cannot be described using methods A or B, use the 'longdesc' attribute. This requires creating an associated long description file accessible via weblink. Select the image, select the Bb image editor, select Advanced, type the weblink into the long desc field. Save your changes with Submit.
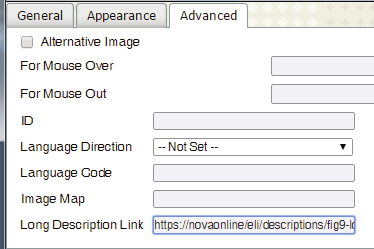
To create a text file describing an image in detail, contact ELI for further assistance. We will create and save a long description file for your image and build a full hyper-link to be used in your course.

An html file named "fig9-longdesc.html" would be created, and the contents would be:
<html>
<p>Modeling amount of daylight as a function of time of year Figure 9 shows graphs of the number of hours of daylight as functions of time of the year at several lattitudes, from March through December... (include as much descriptive text as needed).</p>
</html>
Keep track of your complex images.
The graph image is from Lucia C. Harrison, Daylight, Twilight, Darkness and Time (New York: Silver, Burdett, 1935) page 40.Return to A11Y Overview