Module 3: Protein Data Analysis
BIO 255: Bioinformatics and Computer Applications in Biotechnology
The short answer: The protein sequence dictates its potential structure, and the structure of a protein dictates its function.
If you can begin to unravel the details about a protein or a group of proteins you are well on your way to making solid predictions and hypotheses, designing more informative experiments. On the pharmaceutical front, understanding protein structures allows for rational drug design. The first step however is finding your proteins of interest. You want to identify the specific protein or family of proteins that will fit your need. Read the book chapter "Proteins" from Protein Bioinformatics. Assignment 3.1 directs you to complete exercises 1 (there are multiple ways to complete this exercise), 7, 9, and 10 at the end of the chapter. Compile your answers in a word document and submit your asignment via Blackboard.
In Assignment 3.2 you will select a topic from the list below. As in Unit 2 select a paper that describes a protein of interest. The article and protein identifier are to be submitted to the instructor for approval.
List of topics:
Some Potential Journals to direct your article search (In addition to search PubMed):
Use your Blackboard username and password to sign in if a login page pops up.
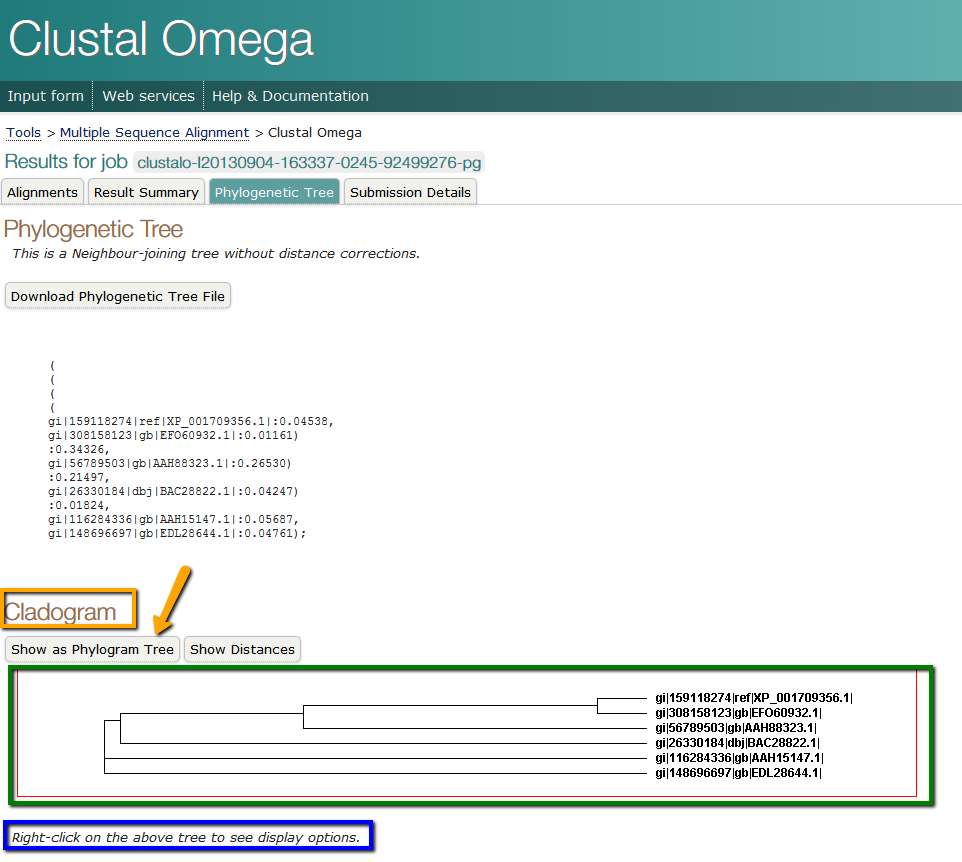
You have the skills learned in Unit 2 to guide you in completing Assignment 3.2 - Phylogentic Analysis. Once your article and protein of interest are approved by the instructor you will perform a BLAST search and create a FASTA file containing the top hits from at least 20 unique species. This file will be used to prepare a multiple alignment, as done in Unit 2. If you have explored the buttons in the Clustal Omega format you already know a quick method for creating a basic phylogenetic tree. Once your alignment is made using Clustal Omega simply click the "Phylogenetic Tree" button, shown below and indicated with the purple arrow. Alternatively you can click the "Send to ClustalsW2_Phylogeny" button and submit your alignment for tree-building on this interface. Both return virtually identical trees. This tree is a graphical view of the relatedness or implied evolutionary relationships among the proteins you identified. This is a realtively simple method for obtaining a phylogenetic tree. Read the article "Phylogenetics: principles and practice" for a more complete assessment of this method. In this article the basic theory behind creating a tree is described. Additionally, several programs are described, along with their strengths and weaknesses.
Once you have your tree output from Clustal Omega, you can format the tree for the best display. In the screen shot below, boxed in blue, is the instruction for modifying the image of your tree. There are several options, inculding changing the font, background color, line color and style of tree (Cladogram is illustrated in the screen shot below). Depending on your presentation style for publication, lab meeting, or conference you may need to alter the appearance of the tree. After you have formatted your tree to your satisfaction (leaving it as originally displayed is acceptable), be sure to take a screenshot of the tree using Jing or any other screen capture application.
Alternative programs for creating a basic tree based on the 21 proteins in your FASTA file include but are not limited to:
A link (Created through Jing or Voice Thread) to your image with a comment from you describing the composition and basic interpreatation of your tree will be posted to the discussion board. You are then required to view and comment on your peer's phylogenetic trees.
In addition to determining the the evolutionary relationship between your proteins and similar proteins from other organisms you can dive deeper into the characteristics of your protein of interest by studying its primary, secondary, and tertiary structure. These levels of organization are critical in determining the function of a protein and understanding how proteins can be engineered or positioned for a purpose. Additionally, identifying the subtle differences among proteins helps explain why some drugs work for only subsets of the world's populations. Read the article "Pharmacogenetics, Personalized Medicine, and Race" from Nature Education and "Pharmacogenetics, Pharmacogenomics, and Individualized Medicine" from Pharmacological Reviews for a specific examples.
In Assignment 3.3 you will conduct basic sequence and structural analysis, as well as 3D modeling of your protein of interest that you selected in Assignement 3.2. When a scientist begins working closely with one protein or a family of proteins she first gathers all the basic information about the protein(s). You will do the same for your protein of interest. The ExPASy website has a wide range of free software tools listed under "Categories --> proteomics --> protein structure" that will be of great use for this Assignment and future characerizations of proteins. Below you find the required data you will obtain for this assignment and a list of selected tools that will help you along your way. Some information may also be best obtained from Phyre2, described below.
DATA to Compile:
Selected online tools:
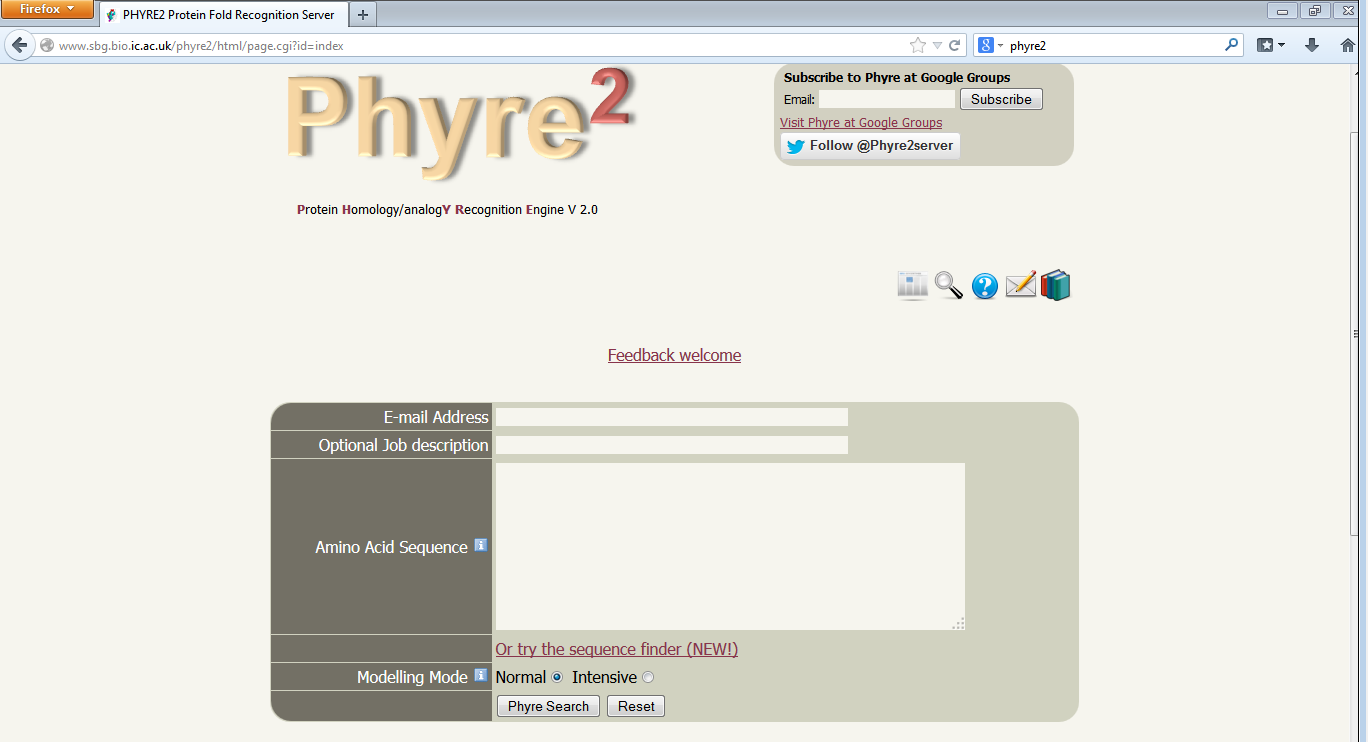
To make predictions about drug design and protein-protein interactions it helps to have a 3D model of your protein of interests. There are many high-end commercial programs that will create highly accurrate models, and there are freely available tools that are more than sufficient for preliminary analysis of proteins. One such freely available tool is called Phyre2 and can be found here: http://www.sbg.bio.ic.ac.uk/phyre2/html/page.cgi?id=index. This program takes several hours to run so plan ahead and do not leave it until the last minute. To submit your sequence for analysis you must enter your email address, it is recommended you enter a job description and finally you select Phyre Search.
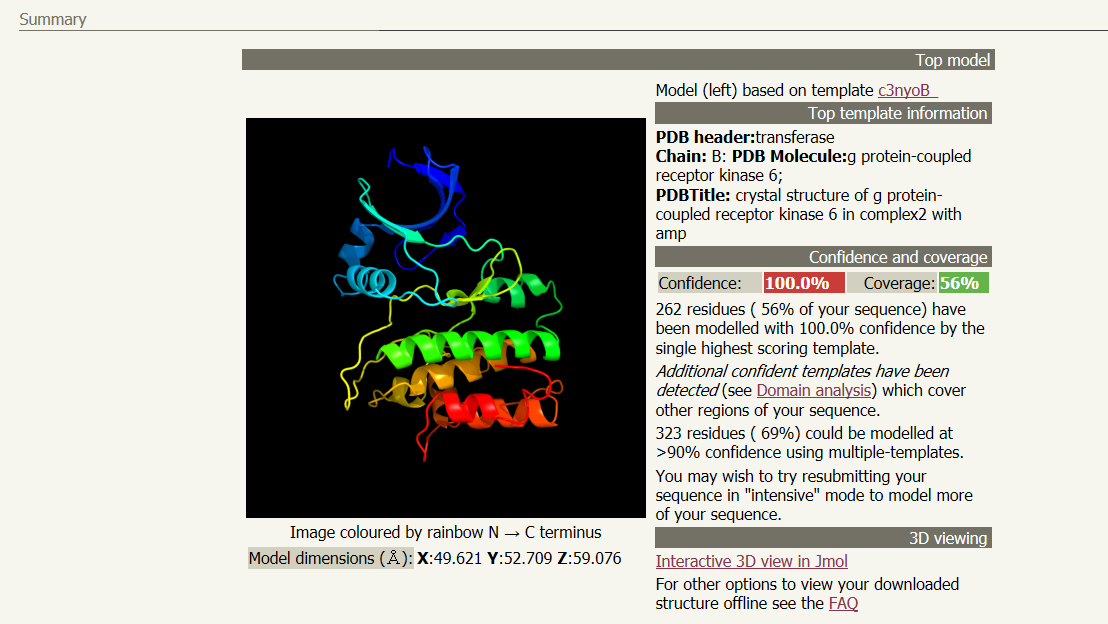
A link will be emailed to you after several hours with the results of the analysis. Follow the link given in the email to your results page. You will see a ribbon style predicted structure for your protein. Other information, including what previously determined structure was used as model and how confident the program is with the predicted stucture can be found next to the structure. In the email will also be a .pdb file containing the data required for other software programs to visualize your 3D structure. A suggested list the viewers and visualizers is below.
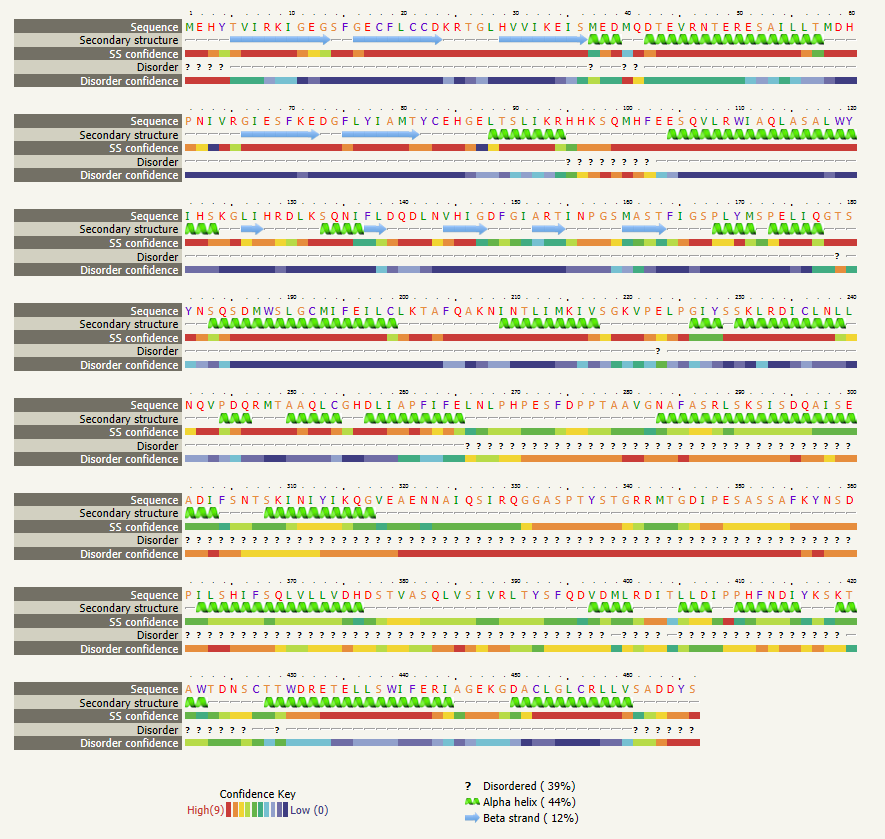
The next section in your results file is the "Secondary structure and disorder prediction", where you are show the number and location of disordered regions, alpha helices, and beta strands (sheets). The sections below secondary strucure analysis detail domain predictions, binding site predictions, and transmembrane helix predictions. You should explore the wealth of data provided by this one tool. Using the skills learned in Unit 1, create a presentation that introduces and describes the characteristics of your selected protein. You are required to create a table detailing the information gathered from the various analysis tools you used. In your presentation be sure to note the tools used to aquire your data.